
A software for the representation of molecules, crystal structures and properties derived from the charge distribution
Authors: Théo Leduc, Vedran Vucovic, Eva Mocchetti, Christian Jelsch & Benoît Guillot, Université de Lorraine, Laboratoire de Cristallographie, Résonance Magnétique et Modélisations, CRM2, UMR CNRS-UL 7036
1. Introduction
MoProViewer [1] is the molecular visualization software associated with the MoProSuite [2] program, specialized in refining crystal structures or electron density models from high-resolution X-ray diffraction data. The MoProSuite consists of two main modules: MoPro, for crystallographic refinement, and VMoPro, for the calculation of properties derived from the charge distribution. Initially, MoProViewer was designed at the CRM2 laboratory to allow a MoProSuite user to graphically configure a calculation using the VMoPro module. Since then, many features have been implemented and continue to be at a regular pace, allowing MoProViewer to be used independently of MoProSuite. MoProViewer is developed with the aim of enabling exploration of properties related to molecular charge distribution by providing a pleasant and intuitive user experience.
2. Molecules and crystal structures visualization
MoProViewer has all the features expected for the representation and study of crystal structures:
- Management and application of space group symmetry operations.
- Measurements of stereochemistry.
- Representation of thermal ellipsoids.
- Detection and representation of hydrogen bonds.
- Display of atom labels.
- Etc.
It can read or export molecular files in CIF, PDB, XYZ, CUBE formats, and of course in the PAR format specific to MoProSuite. Its user-friendly interface allows the user to easily generate equivalent molecules by the symmetry operations of the space group, and then navigate between them using a Tree-view tool describing the displayed system (Figure 1). MoProViewer offers standard display modes: « lines », « balls & sticks », « cpk », and « cartoon » (for proteins). All modes are highly configurable. High-resolution images can be exported in a quality compatible with publication standards.
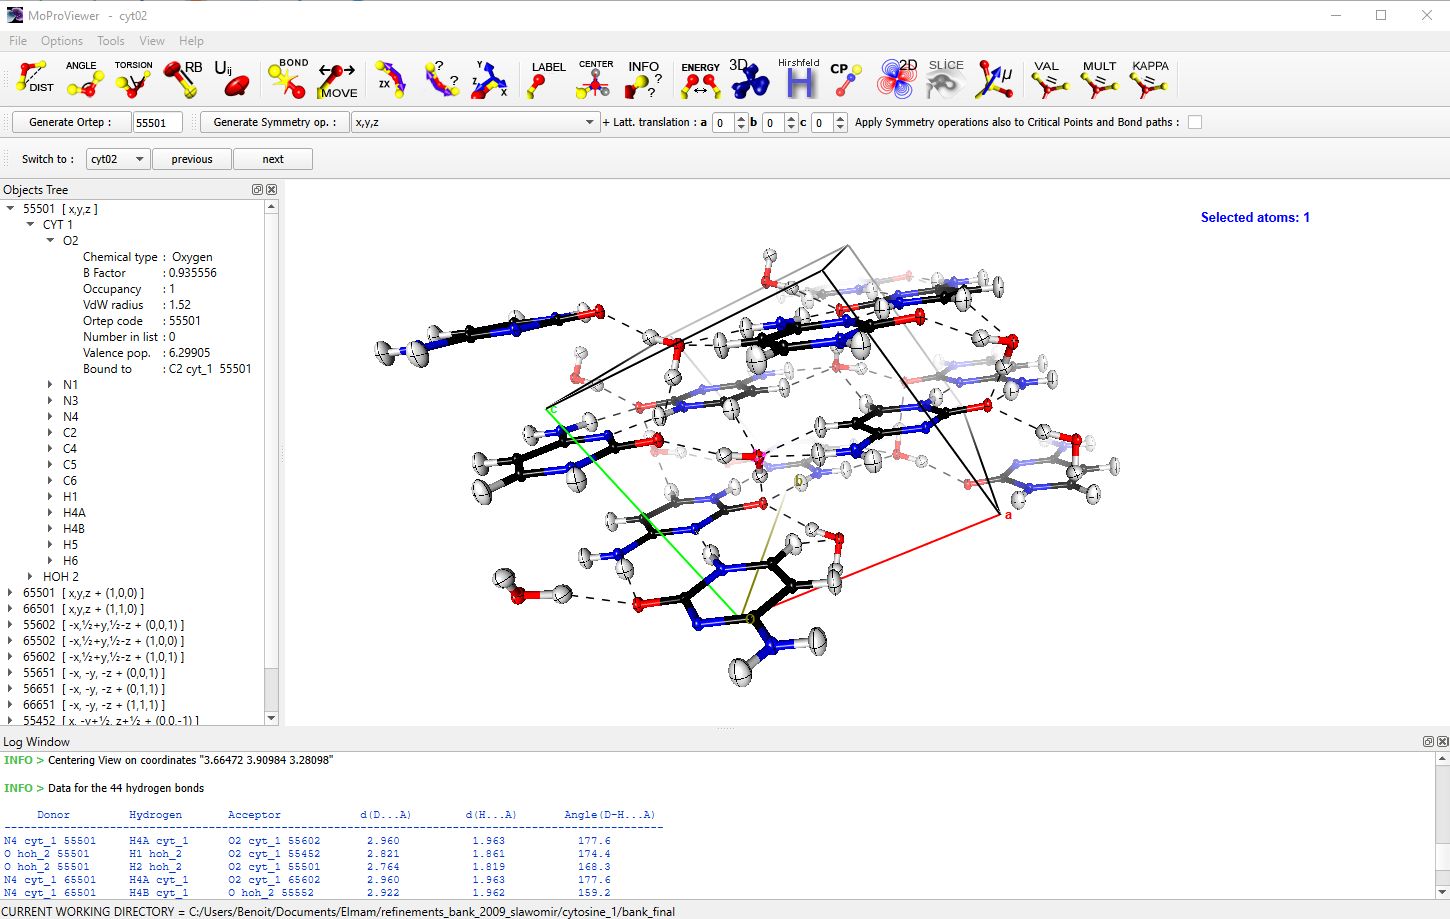
Figure 1 : Main window of MoProViewer. A portion of the crystal of Cytosine monohydrate is displayed [3]. Equivalent molecules by symmetry within and around the unit cell are represented in „balls & sticks“ mode with thermal displacement ellipsoids at 50% probability. The object tree is visible on the left, where symmetric molecules are identified by their ORTEP codes and their equivalent positions. In the information window (at the bottom), data on hydrogen bonds detected by MoProViewer are displayed.
3. Monitoring an electron density refinement with MoProSuite
MoProViewer can be considered as a graphical interface for VMoPro. With just a few mouse clicks, based on the representation of the molecule being refined, the user can request VMoPro to calculate any property accessible to it in MoProViewer. MoProViewer then displays the calculation result. The properties available via VMoPro are numerous, ranging from various electron densities (total, deformation, valence, etc.) to derived properties such as electrostatic potential, Laplacian of electron density, electrostatic interaction energy, etc. The display modes in MoProViewer are either in 2D (contour maps) or in 3D (property iso-surfaces). MoProViewer has a large number of features in terms of configuring these representations (Figures 2, 3, 4).
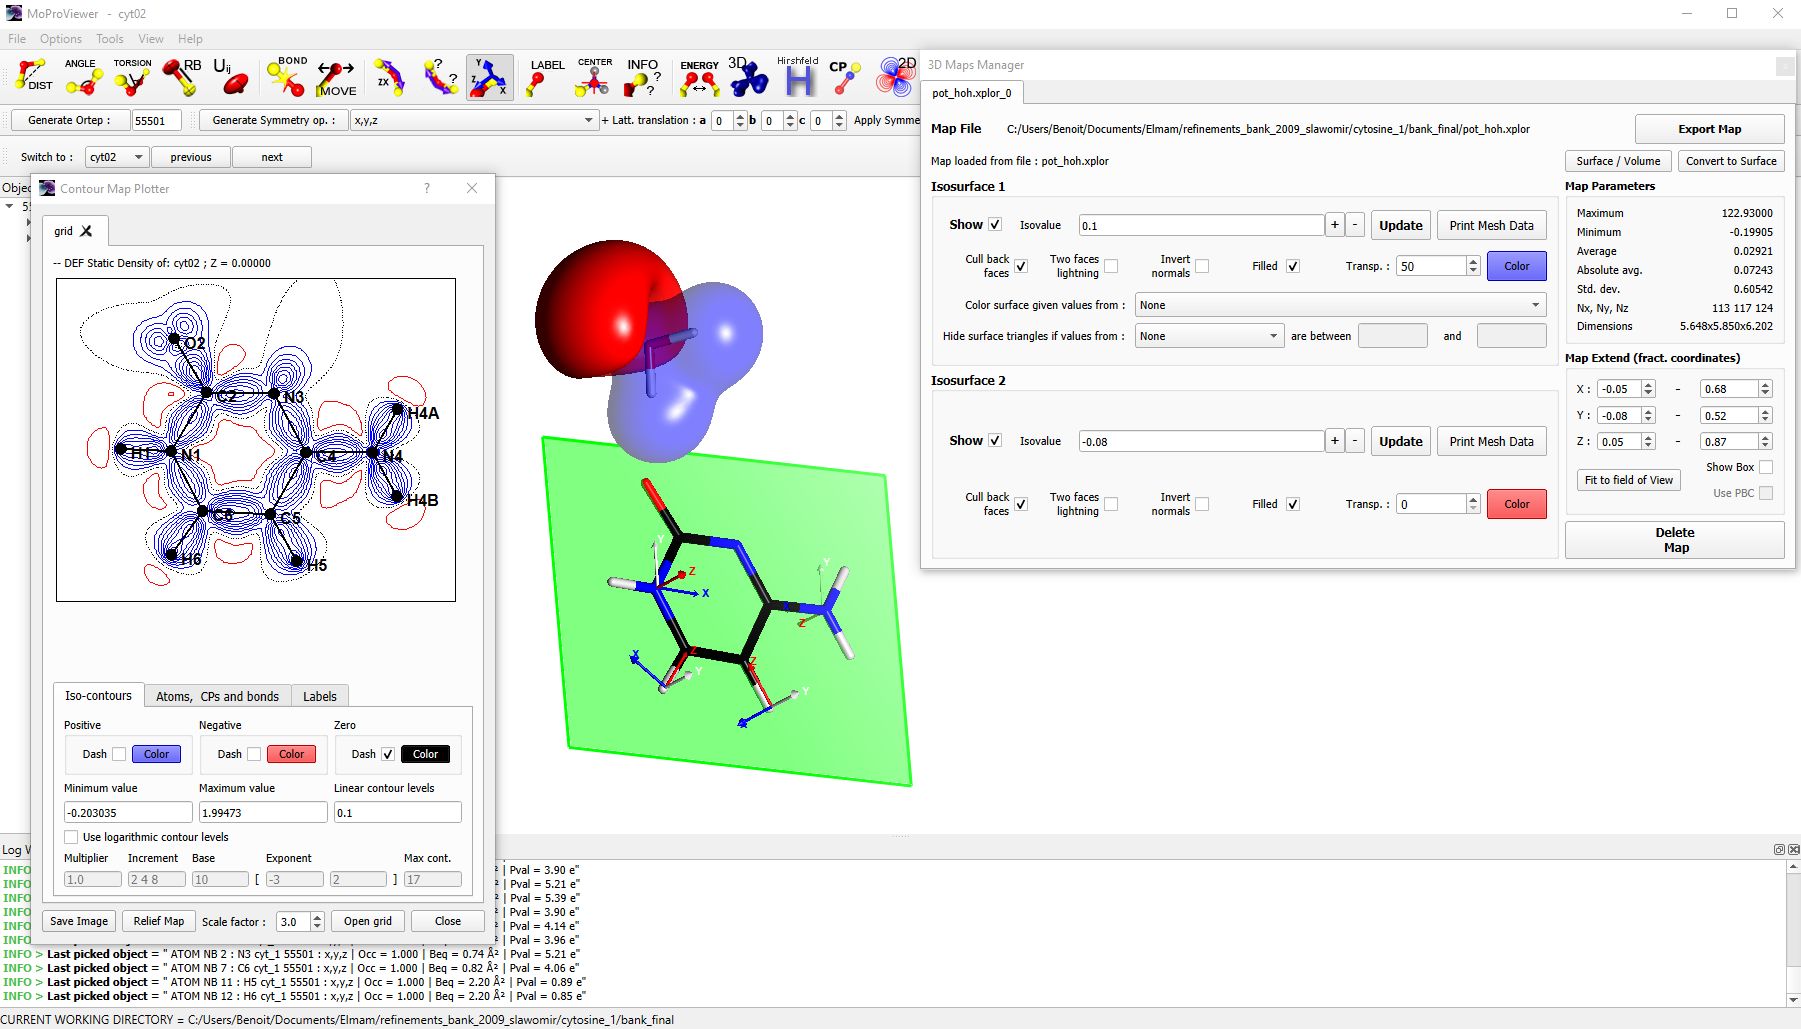
Figure 2 : The dimer of Cytosine monohydrate is depicted. The water molecule is surrounded by electrostatic potential iso-surfaces (negative contour of -0.08 e/Å in red, positive of 0.1 e/Å in blue). The „3D Maps Manager“ tool is visible on the right. The static deformation electron density of the cytosine molecule is represented in contour maps in the dedicated configuration tool (on the left), calculated in the visible green plane. The atomic markers used in multipolar modeling [4] are visible on some atoms of the cytosine molecule.
4. Properties derived from the charge distribution
In addition to its role as an interface for the VMoPro program, MoProViewer has a large number of functionalities that allow it to be used independently of the MoProSuite.
Scalar fields
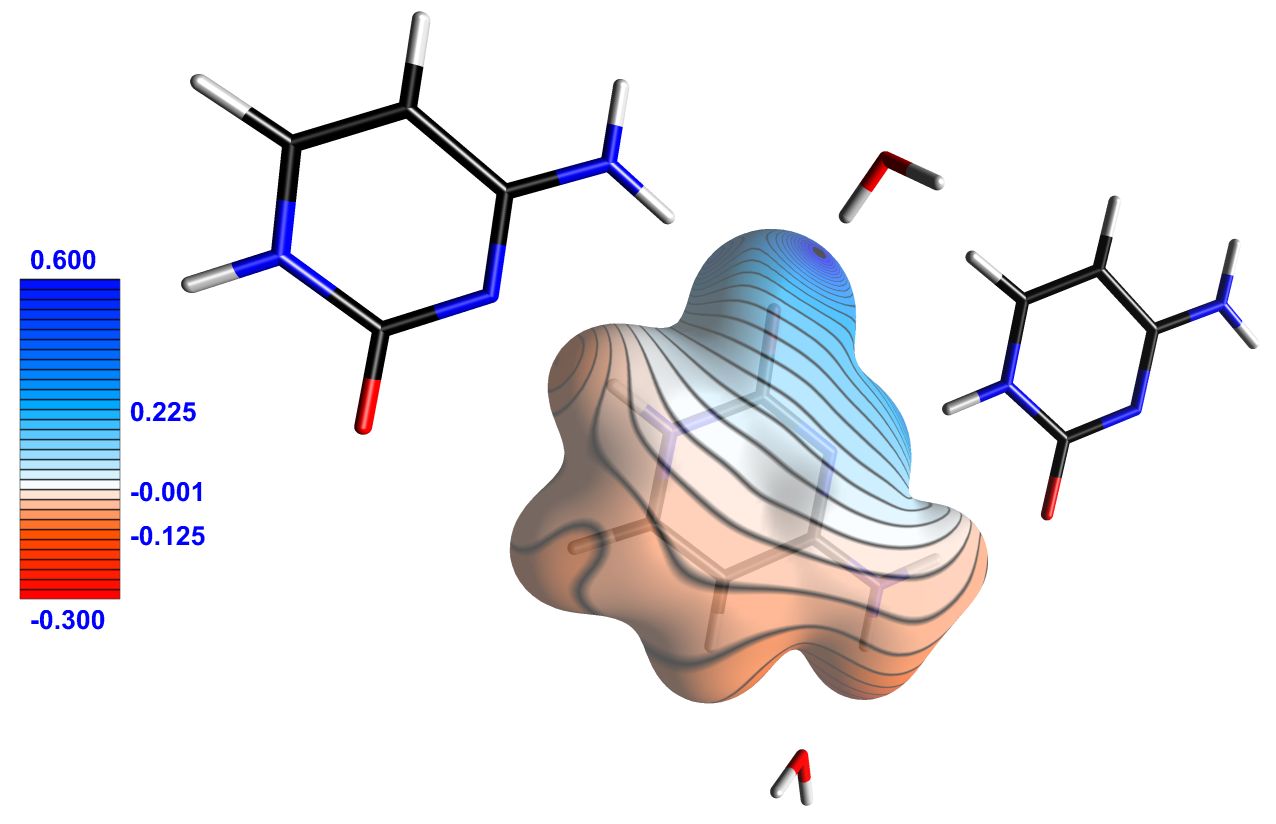
MoProViewer can read, export, and display isosurfaces of scalar fields in Gaussian, CUBE, XPLOR, or POSCAR formats. It can also calculate scalar fields of spherical electron density and Coulombic or multipolar electrostatic potentials generated by any selection of atoms in the represented molecules. Each read or calculated „3D map“ appears as a tab in the „3D Maps Manager“ tool (fig. 2), allowing two isosurfaces to be displayed (typically one with a negative value and one with a positive value). In MoProViewer, each isosurface of a given scalar field can be colored based on the values of any other scalar field. This allows, for example, very easily creating images of molecular surfaces colored by electrostatic potential (fig. 3).
(a)
(b)
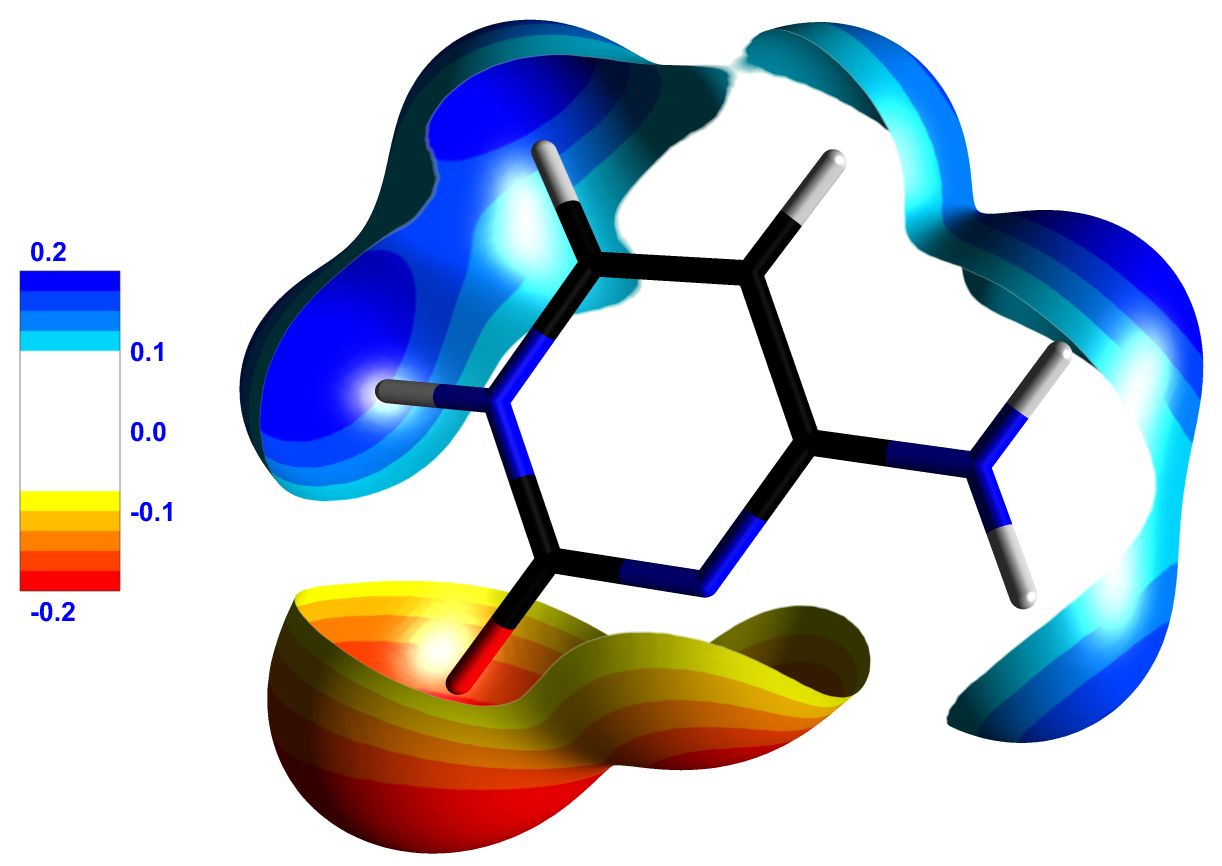
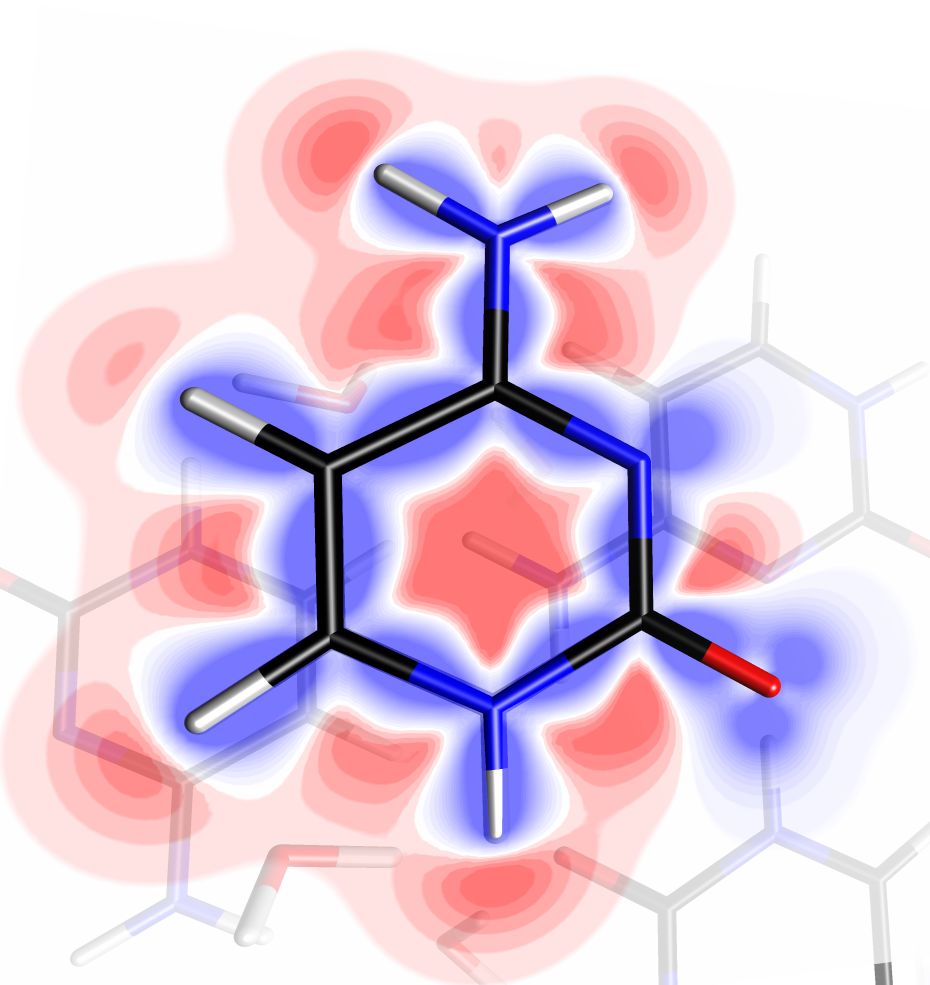
Figure 3 : (a) Cytosine molecule represented surrounded by an isosurface of 0.1 e/Å3 of total electron density. The surface is colored by the electrostatic potential generated by the crystalline environment. (b) Cytosine molecule represented surrounded by an isosurface of 0.05 e/Å3 of total electron density, colored by its own electrostatic potential. Only regions of the surface where the potential is greater than 0.1 e/Å or less than -0.1 e/Å are shown, making its electrophilic and nucleophilic sites clearly visible. The legends indicate the values of the electrostatic potential (in e/Å). Images exported by MoProViewer.
A very user-friendly tool for exploring scalar fields is available in MoProViewer, in the form of a movable plan, line, or point controlled by the user’s mouse. This tool allows for the representation of any cross section of the scalar field, tracing a curve in any direction, or simply exploring the value at a given point. Additionally, this tool allows for the representation of gradient lines of the scalar field passing through the manipulable object. In the case of a scalar field of electrostatic potential, MoProViewer thus allows for the graphical and quantitative study of the topography of electric field lines (fig. 4).
(a)
(b)
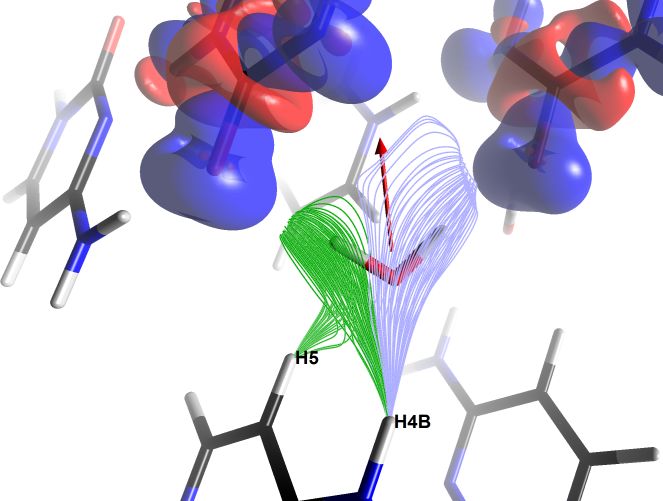
Figure 4 : (a) Static deformation electron density represented for a cytosine molecule in a crystal using the scalar field exploration tool. The density is projected onto a translucent cross-sectional plane, negative in red and positive in blue. The visible contours are approximately ±0.3 e/Å3. (b) Electric field lines experienced by a water molecule in a monohydrate cytosine crystal. Two bundles of lines are shown, created using two instances of the scalar field exploration tool. The lines emanate from the H5 and H4B atoms of a cytosine molecule and converge towards pairs of free electron atoms of oxygen in carbonyl groups of two other molecules (whose static deformation electron densities are represented by translucent isosurfaces of values ±0.05 e/Å3). The relative alignment of the electric field lines with the dipole moment of the water molecule is evident, represented in red (scale 3.3 Å/eÅ, value 0.48 eÅ or 2.3 D). Images exported by MoProViewer.
ED topology
MoProViewer allows for topological analysis within the framework of the Quantum Theory of Atoms in Molecules (QTAIM) [5], based on a scalar field of the total electron density, either from a CUBE file, for example, or calculated by MoProViewer. The search for critical points and topological basins is performed numerically and rapidly thanks to algorithm parallelization. MoProViewer allows for the representation of critical points, interaction paths, and topological basins. Integration of any scalar field into atomic basins is also available (fig. 5).
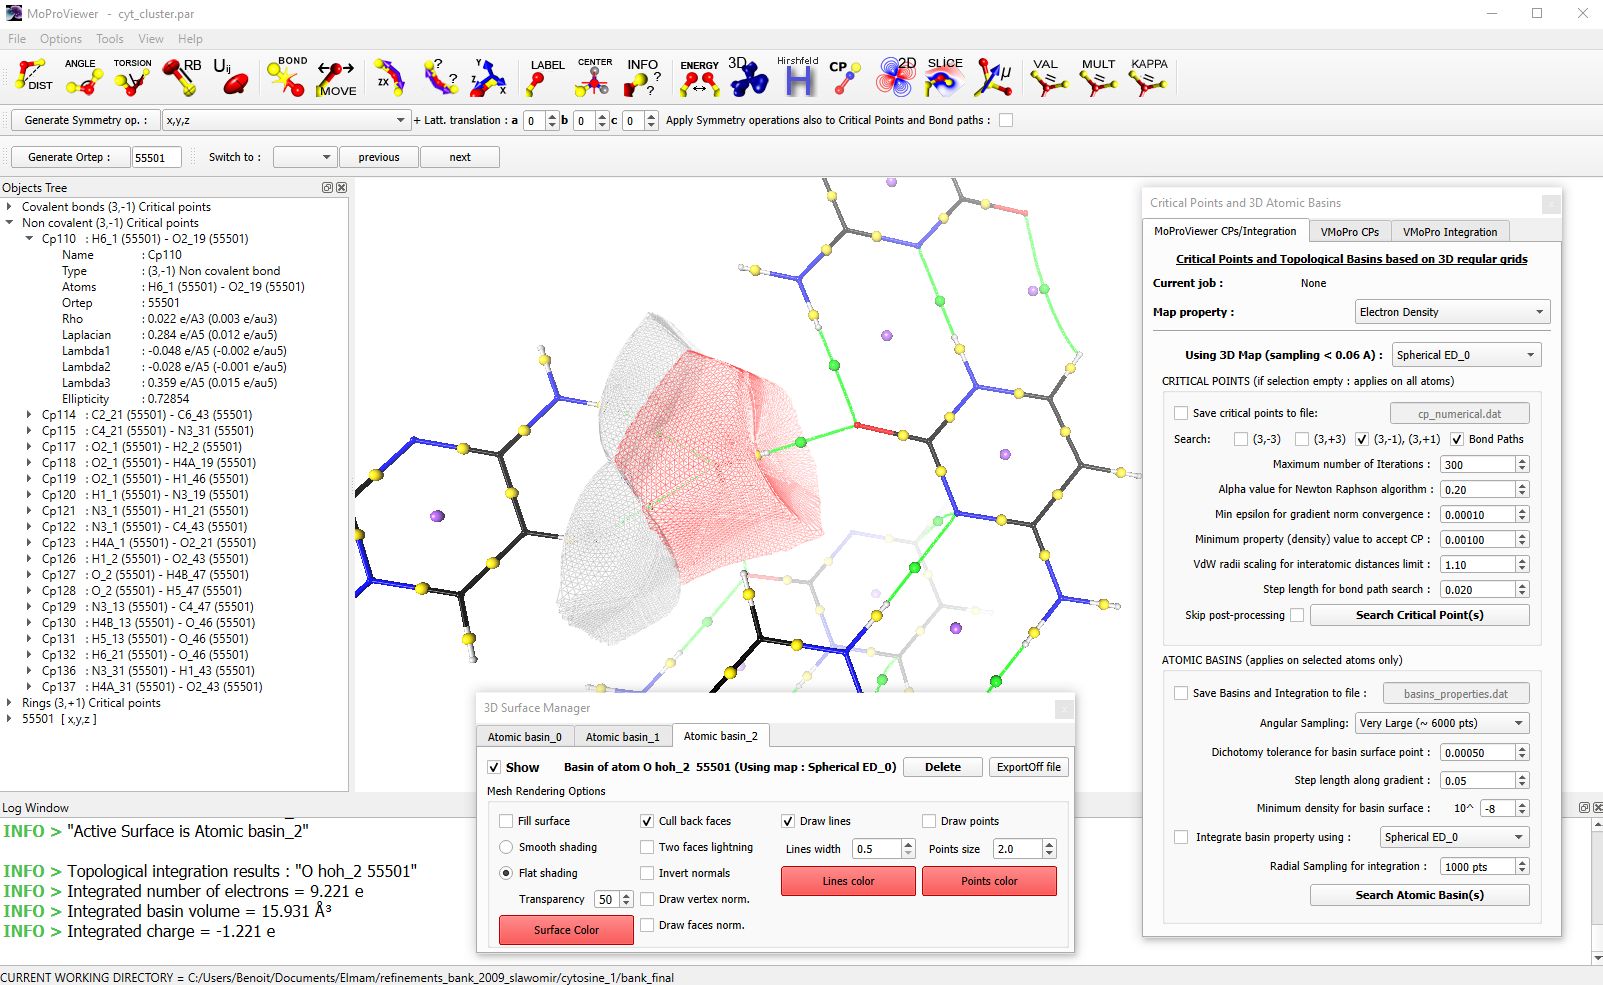
Figure 5 : A portion of the cytosine monohydrate crystal is shown. Critical points of covalent bonds are represented in yellow, hydrogen bond critical points in green, and cycle critical points in blue. The critical points appear in the object tree visible on the left. Three topological basins are represented in wireframe mode: those of an oxygen atom of a water molecule (in red) and those of two hydrogen atoms of a neighboring cytosine molecule. In the information window (at the bottom), information on the integration of the electron density in the basin of the oxygen atom is visible. The topological analysis tool is visible on the left, and the atomic basin management tool is visible at the bottom.
ED transfer and polarization
The CRM2 has developed a library of experimental multipolar parameters describing the average electron density and anisotropic polarizability of many types of atoms encountered in organic molecules [6]. These parameters can be transferred to a structure whose atom types are compatible, to quickly obtain a reliable model of its total charge distribution, including atomic polarizabilities. MoProViewer has a transfer tool specially adapted to protein structures („Beluga“ [7]). This tool also allows, through transferability, to calculate the mutual dipole induction between two selections of atoms, such as between a protein and its ligand (fig. 6).
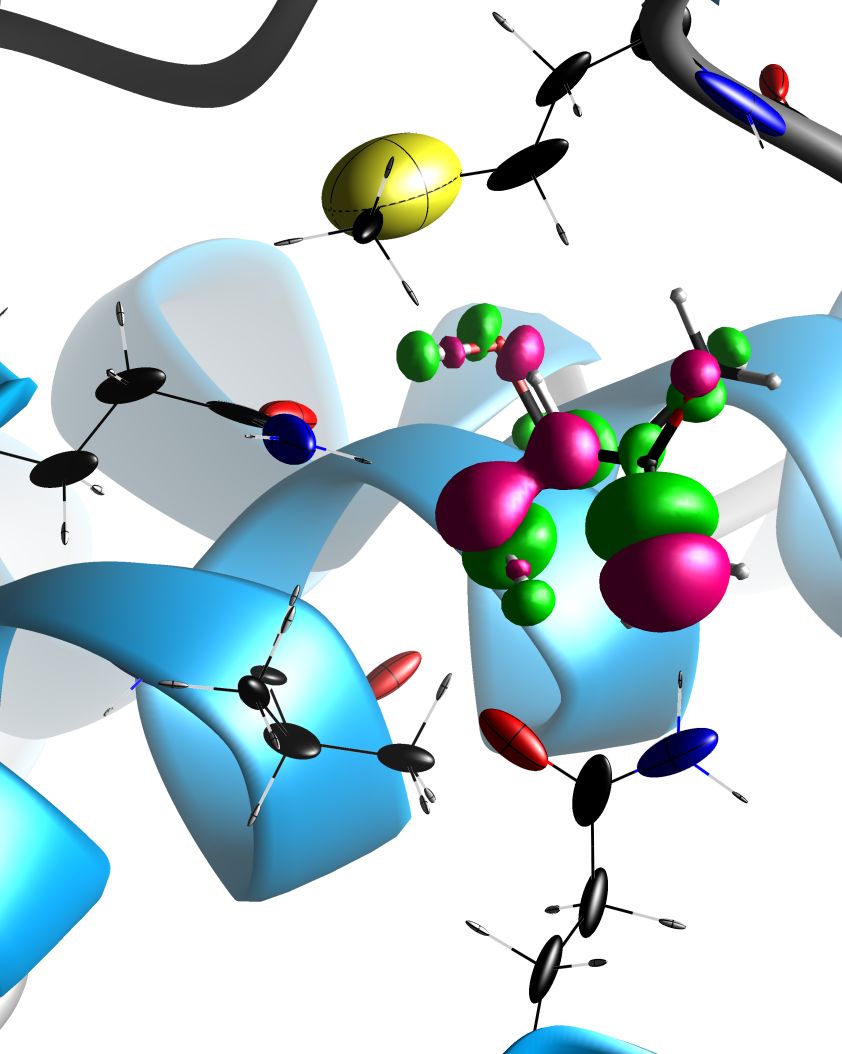
Figure 6 : a ligand of the Panthotenate Synthetase protein (PDB code: 1N2J) is shown in its binding site, with the induced electron density shown in isosurfaces of ±0.02 e/Å3. This electron density is shown in pink where the polarization phenomenon has led to an accumulation of electron density, and in green in the opposite case. The atomic polarizability tensors of the amino acids near the ligand are shown as ellipsoids.
Fast electrostatic interaction energy computation
A multipole electron density model (through refinement or transfer) allows for the calculation of electrostatic interaction energies. MoProViewer has a very fast energy calculation tool (called ‚Charger‘ [8]) between any two selections of atoms in the system being represented. This tool is particularly useful for protein-ligand systems, and allows for the determination of the electrostatic interaction energy contributions of each amino acid, notably (fig. 7).
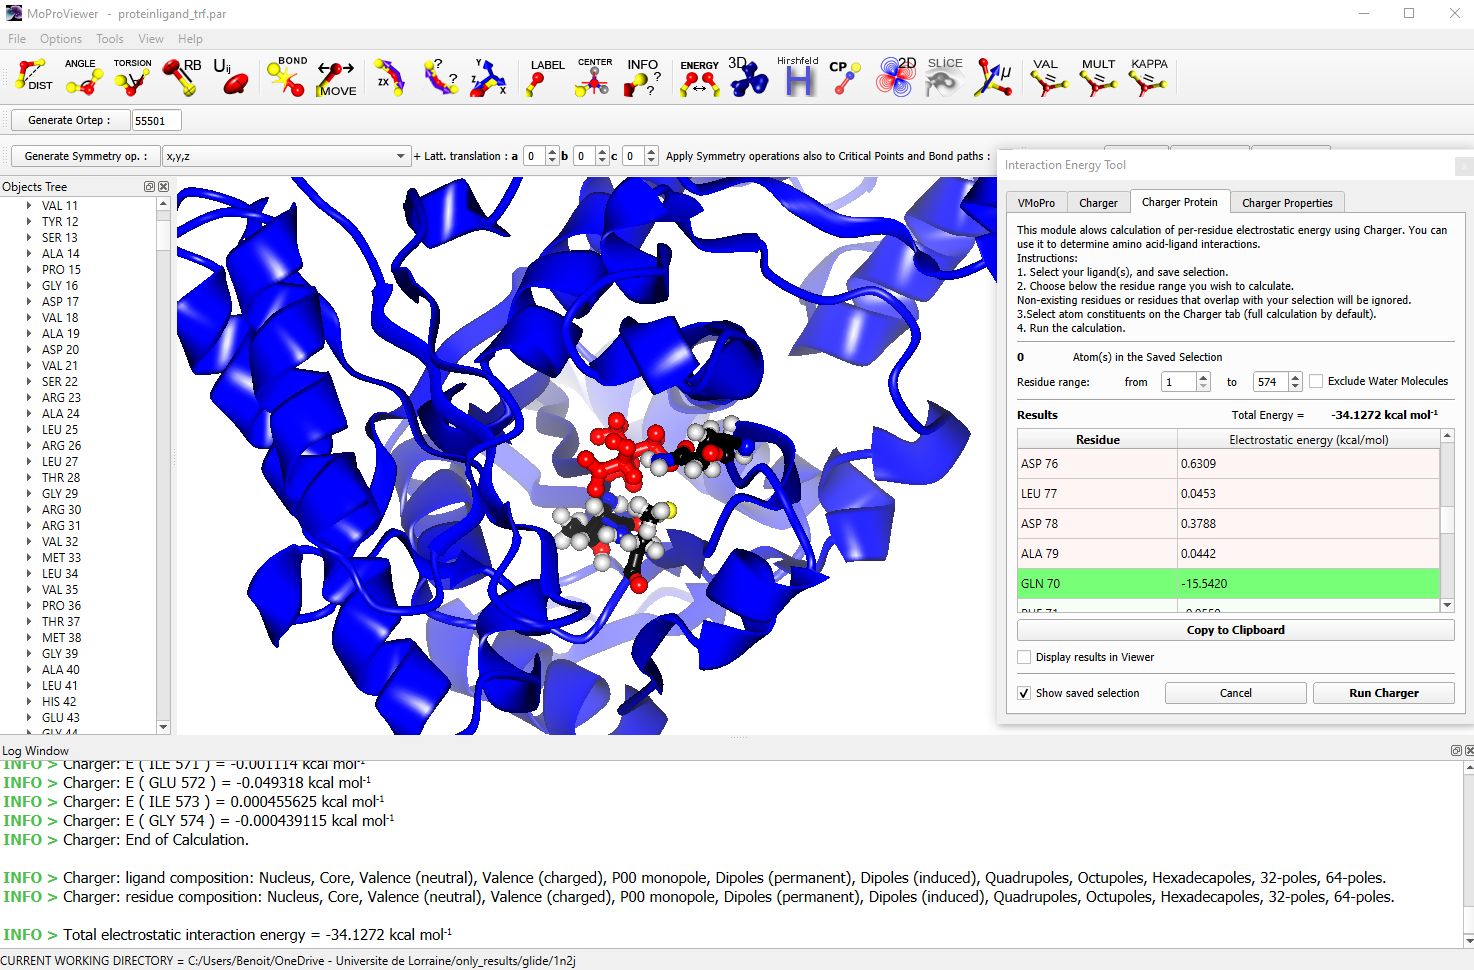
Figure 7 : The structure of Panthotenate Synthetase protein represented in cartoon mode. The ligand is in red and only the two residues that contribute the most to the electrostatic stabilization of the ligand are shown. The fast energy interaction calculation tool is visible on the right, with the contribution of GLN70 shown in green. The calculation of the contributions of the 574 amino acids to the total electrostatic interaction energy between the protein and the ligand takes about ten seconds on a recent Intel® Core i7.
4. References
[1] B. Guillot, E. Espinosa, L. Huder and C. Jelsch. Acta Cryst. (2014). A70, C279.
[2] B. Guillot, L., Viry, R., Guillot, C., Lecomte, C., & Jelsch. J. Appl. Cryst (2001) A34, 214-223; C. Jelsch, B. Guillot, A. Lagoutte and C. Lecomte J. Appl. Cryst. (2005). 38, 38-54.
[3] P. Munshi & T.N. Guru Row. Acta Cryst. (2006). B62, 612-626.
[4] N. K. Hansen & P. Coppens. Acta Cryst. (1978). A34, 909-921.
[5] R. W. F. Bader (1990) Atoms in Molecules: A Quantum Theory. Oxford University Press, Oxford.
[6] S. Domagała, B. Fournier, D. Liebschner, B. Guillot, C. Jelsch Acta Cryst. (2012) A68, 337-351.
[7] T. Leduc, E. Aubert, E. Espinosa, C. Jelsch, C. Iordache, B. Guillot. J. Phys. Chem (2019) A123, 7156-7170.
[8] V. Vuković, T. Leduc, Z. Jelić-Matošević, C. Didierjean, F. Favier, B. Guillot, C. Jelsch Acta Cryst. (2021). D77, 1292-1304.
